
HOW CENTRAL & SOUTH-EAST EUROPEAN COUNTRIES STAND IN INNOVATION
Bulgaria ranks 2nd most innovative country in the world in the upper middle-income group, following China
On September 23, 2021, just 10 days ago the World Intellectual Property Organization released the 14th edition of Global Innovation Index 2021 Report.
This global report ranks 132 countries along 21 categories and 81 subcategories, such as: Business Sophistication, Knowledge and Technology Outputs, Infrastruction, Market Sophistication, etc.
As the Report states, ‘On average, Europe is the second best performer worldwide, behind Northern America, in all GII pillars, except for Market sophistication, where it is also behind the average of the SEAO region. Finland has the most highly performing Institutions in the region (2nd worldwide). Sweden leads in Human capital and research (2nd) and Business sophistication (1st), Norway comes top in Infrastructure worldwide (1st), while the United Kingdom leads in Market sophistication (4th). Switzerland is the regional leader in innovation outputs: it ranks 1st worldwide in Knowledge and technology outputs and 2nd in Creative outputs.’ [p.27]
The report exhibits precise ranking of all Central & South-East European countries along all categories and subcategories. However, our team inquired how CSEE countries stand compared to Western economies. This is why we traced all parameters and generated the 2 continua below.
Before heading on to this short analytical overview, let us first list all Central & South-East European countries. These are: Slovakia, Bulgaria, Czech Republic, Slovenia, Croatia, Serbia, Hungary, Romania, Greece, Poland.
We tracked (1) the ranking position of each of them, and (2) listed the overall score corresponding to that position. Surprisingly, though both parameters are closely interrelated, when positioning the countries along the 2 continua we get different insights.
The top 5 most innovative CSEE countries in terms of their overall ranking position are: Czech Republic [24], Slovenia [32], Hungary [34], Bulgaria [35], and Slovakia [37].

Evident from the first continuum ‘2021 Global Innovation Index: Overall Ranking Position’, all CSEE countries are in the Top 50 % quantile. The continuum quantiles are formed via dividing 132 countries by 4. Consequently, each quantile corresponds to 33 countries.
Some of the CSEE such as Czech Republic are in the top 25 % quantile. In the case of Czechia, the country has the same score as Luxemburg and Belgium. Despite the fact that the Report ranks it 24th, Czech Rep. has the same score as Luxemburg [ranked 23rd], and a very similar score to Belgium [ranked 22nd]. This is just an example on who close some CSEE countries come to Western European [WE] countries in terms of innovation performance.
The Report also distinguishes on the innovation performance of countries depending on their income. The top 3 innovation economies per income group are as follows,
High-income: Switzerland, Sweden, the USA
Upper middle-income: China, Bulgaria, Malaysia
Lower middle-income: Viet Nam, India, Ukraine
Low-income: Rwanda, Tajikistan, Malawi
Though the ranking of countries is based on the overall score each country gets, when comparing countries per their score, we get additional insights.
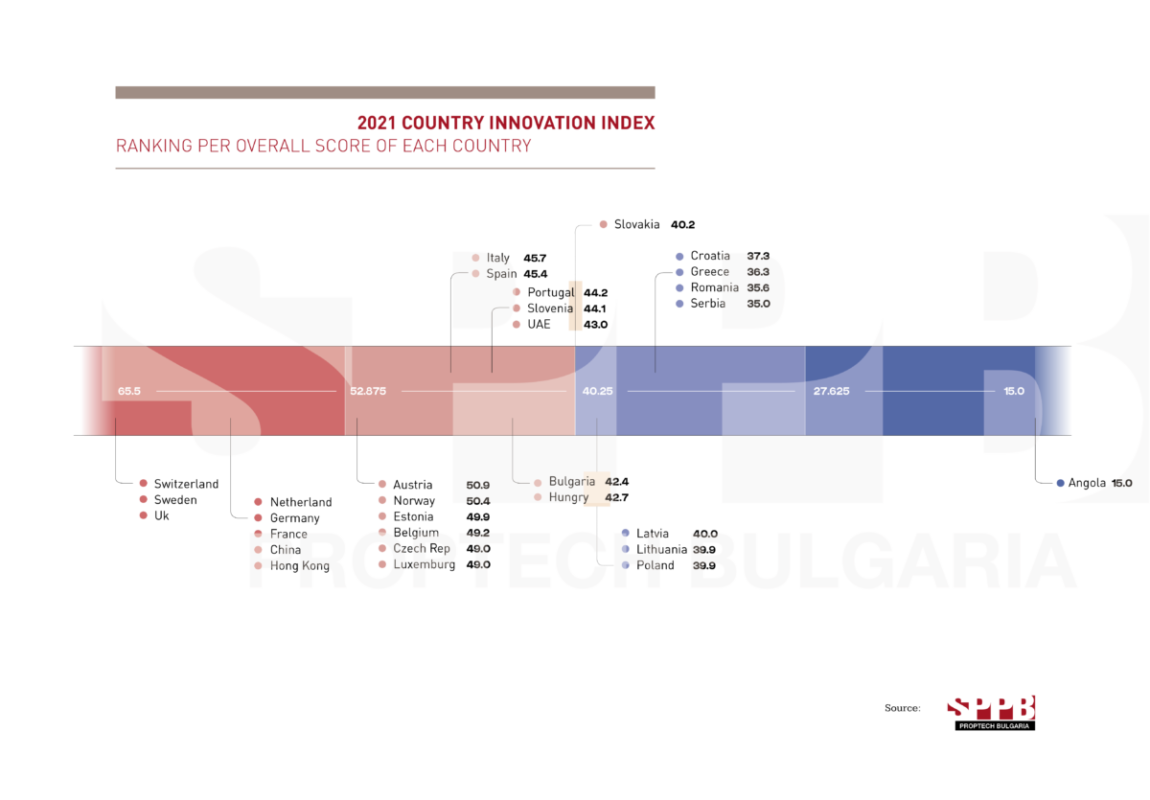
The sendond continuum ‘2021 Country Innovation Index: Ranking per overall score of each country’, shows in a very clear-cut way that CSEE countries rank the same as WE countries.
The 2nd continuum quantiles are formed in the following rationale: we took as 100% the highest score, which is 65.5 points for Switzerland; the lowest score of 15.0 points [Angola] is equals 0 %. The 4 quantiles are formed when we divide 65.5 per 4.
In addition to the WE economies, we have included the scores of a number of world innovation renouned countries such as China, UAE, Hong Kong. We have pointed out their position in order to clearly highlight the innovation level of CSEE countries.
Obviously from this 2nd continuum, most WE economies together with the USA and China are grouped in the top 25% of innovation countries.
However, the 2nd quantile, that is the top 50 % quantile, groups a considerable number of WE countries such as Austria, Belgium Luxemburg, Italy, Spain, Portugal together with all but 5 CSEE countries, these being the top 5 most innovative CSEE countries: Czech Republic, Slovenia, Hungary, Bulgaria, and Slovakia. The other 5 CSEE countries are positioned in the upper end of the 3rd quantile, these being: Poland, Croatia, Greece, Romania, Serbia.

As the Report states, ‘Europe is still the second most innovative region in the world. It hosts a large number of innovative economies: 16 European economies are innovation leaders (i.e., in the top 25). A total of 10 economies move up the ranks this year: France (11th), Iceland (17th), Austria (18th), Estonia (21st), Hungary (34th), Bulgaria (35th), Slovakia (37th), Lithuania (39th), the Russian Federation (45th) and Belarus (62nd).’
Bulgaria is considered to be an innovation achiever in 2021 together with 18 other countries exhibited on the figure to the left.
The same day when Global Innovation Index 2021 Report was released, Startup Genome also announced ‘The Global Startup Ecosystem Report GSER 2021’. This second report is based on input information by local providers.
Hence, there is sufficient information for certain countries and cities, and no information about many others. However, we would like to pay attention to a number of interrelations which become very evident when considering the results of both reports.
For example, we can argue that there is a direct link between the level of external funding availability and the innovation level of a country. France and Switzerland have some of the highest levels and quality of funding [Startup Gemone, p. 38], and we find them among the most innovative countries.
Though according to GII 2021 North America is the most innovative continent, followed by Europe, Startup Genome paints a different picture.
‘Europe is the leading continent for Emerging Ecosystems, with 38 cities in the list followed by North America with 32 startup ecosystems and Asia-Pacific is third with 22 ecosystems. Combined, the Emerging Ecosystems represent 49 countries and $348 billion in Ecosystem Value… Startups have become a top growth engine of the economy and policymakers are putting more energy and focus into the development of their startup ecosystems.’ [p.43]
Next, the Report lists Warsaw [Poland], Budapest [Hungary], Bucharest [Romania], Belgrade & Novi Sad [Serbia], Ljubljana [Slovenia], and Prague [Czech Republic] among the 100 emerging startup ecosystems [p.46]. As we underlined above, this Report does not contain information about so many countries like GII 2021. This is it does not display any information about Bulgaria and Croatia.
Just to add one more perspective to the whole picture, we can include also a review on the overall number of R&D centers in the SEE countries. The Recursive in their article dd 01.06.2021 display how Greece, Serbia, Romania, and Bulgaria stand in terms of number and type of corporate R&D centers. The result is as follows,
● Bulgaria – 27 R&D centers, and the most outstanding ones are those of SAP Labs, VMware, Paysafe, and Sensata Technologies;
● Romania – 24 R&D centers with Amazon and Adobe leading the list of the largest investments;
● Serbia – 14 R&D centers with Microsoft, Continental, and NCR heading the list of largest investors;
● Greece – 13 R&D centers with Microsoft and Volkswagen as the most remarkable ones.
To conclude, both GII 2021, and Startup Genome 2020 report put CSEE countries under the spotlight not only in terms of their high-growth potential, but also high achivements in innovation.
EASTERN EUROPEAN FUNDING IN NUMBERS: HOW EE STANDS
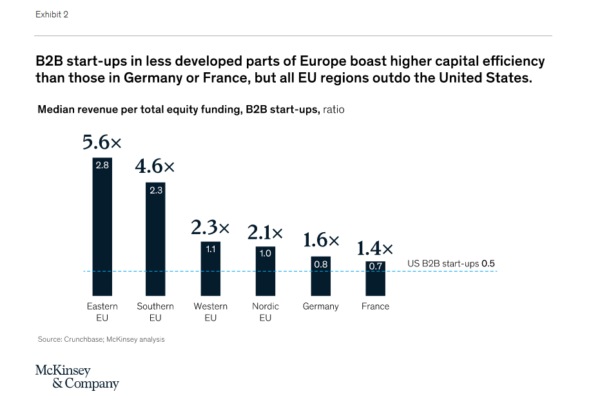
McKinsey[1] (2021) in their report ‘Europe’s innovation wunderkinds: The rising B2B start-up ecosystem’ state as follows, ‘Comparing different regions in Europe, we observe that the funding efficiency (revenue per total amount of funding) is indeed higher in regions of Eastern and Southern European countries, where funding is least abundant (Exhibit 2). By contrast, the largest European start-up ecosystems in Germany and France have the lowest revenue-per-funding ratios in Europe; nevertheless, they still generate about 1.5 times more revenue per dollar invested thatn B2B start-ups in the United States’.
EUROPEAN PROPTECH IN NUMBERS PER COUNTRIES AND REGIONS
The reason to undertake making these maps is very simple: when we tried to figure out how Eastern Europe is being positioned on international level in PropTech, we found no information in one place which explicitly and clearly displays the big picture, particularly the number of PropTech companies in different geographical regions; which are the most dominant continents in PropTech (based on nr of generated tech solutions); how different European regions differ when compared to each other, and most importantly what the position of Eastern Europe is.

… and MOST IMPORTANTLY, DON’T MISS SEE PROPTECH CONFERENCE on 04 Nov. 2021